Exporter for Apache Kvrocks™
Like the Redis metrics monitor, Kvrocks also exports the internal metrics to INFO commands.
Users can collect and store those metrics, we also provide the Kvrocks exporter for Prometheus metrics since it's widely used now.
Kvrocks Grafana dashboard template is available on Grafana.com. You can import the Dashboard with ID 15286 or downloads the JSON file:
wget https://grafana.com/api/dashboards/15286 -O kvrocks-dashboard.json
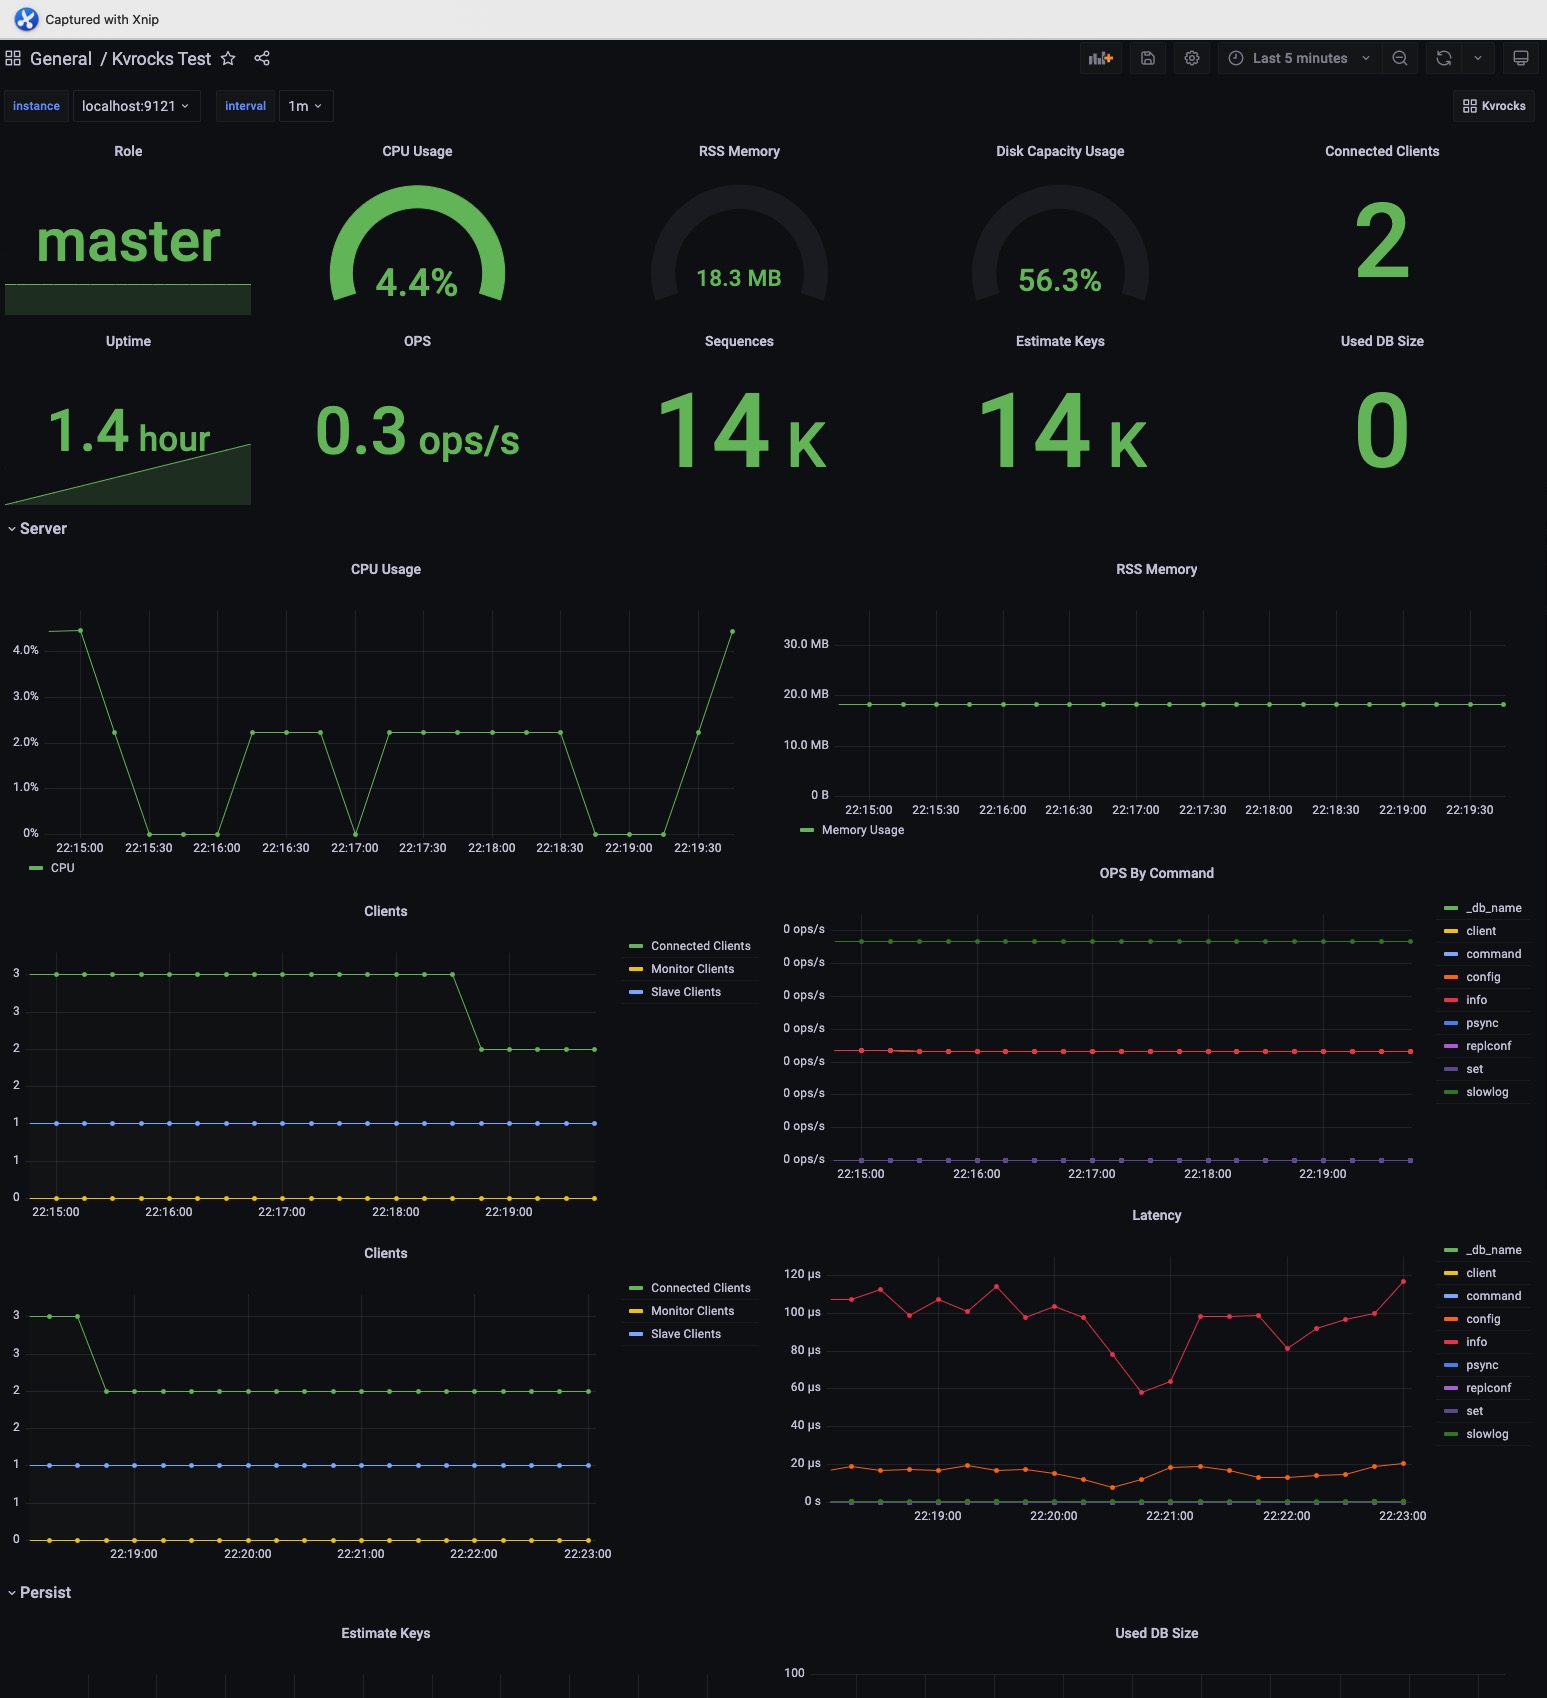
Example Grafana screenshots: