
Learn how to use go-redis client to get started with Apache Kvrocks, a distributed key-value NoSQL database.
What is Kvrocks?
Apache Kvrocks is a distributed key-value NoSQL database that uses RocksDB as a storage engine and is compatible with Redis protocol.
You can use Kvrocks as a drop-in replacement for Redis to store data on SSD, reducing storage costs and increasing capacity. For example, imagine taking one of the many existing Redis-based job queues and using them with Kvrocks and SSD storage.
Kvrocks supports most Redis commands including the watch command starting from v2.4.0. Kvrocks Cluster and replication are available as well.
Getting started with Kvrocks
You can launch Kvrocks using Docker:
docker run -it -p 6666:6666 apache/kvrocks
And start using it right away:
redis-cli -p 6666

127.0.0.1:6666> get foo
(nil)
127.0.0.1:6666> set foo bar
OK
127.0.0.1:6666> get foo
"bar"
You can also build Kvrocks with GCC yourself.
Connecting to Kvrocks from Go
Since Kvrocks uses Redis-compatible protocol, you can use your favorite Redis client to work with Kvrocks, for example, Go Redis client:
package main

import (
    "context"
    "github.com/redis/go-redis/v9"
)

func main() {
    ctx := context.Background()

    rdb := redis.NewClient(&redis.Options{
        Addr: "localhost:6666",
    })

    err := rdb.Set(ctx, "key", "value", 0).Err()
    if err != nil {
        panic(err)
    }

    val, err := rdb.Get(ctx, "key").Result()
    if err != nil {
        panic(err)
    }
    fmt.Println("key", val)
}
Pipelines, pub/sub, and even Lua scripts are working as well:
var incrBy = redis.NewScript(`
local key = KEYS[1]
local change = ARGV[1]

local value = redis.call("GET", key)
if not value then
  value = 0
end

value = value + change
redis.call("SET", key, value)

return value
`)
You can then run the script like this:
keys := []string{"my_counter"}
values := []interface{}{+1}
num, err := incrBy.Run(ctx, rdb, keys, values...).Int()
Monitoring Kvrocks
Monitoring Kvrocks performance is crucial to ensure optimal operation and identify any potential bottlenecks or issues.
OpenTelemetry provides instrumentation libraries and integrations for monitoring Kvrocks using its unified observability framework.
What is OpenTelemetry?
OpenTelemetry is an open-source observability framework designed to standardize and simplify the collection, analysis, and export of telemetry data
OpenTelemetry allows developers to collect and export telemetry data in a vendor agnostic way. With OpenTelemetry, you can instrument your application once and then add or change vendors without changing the instrumentation, for example, here is a list DataDog competitors that support OpenTelemetry.
What is Uptrace?
Uptrace is an OpenTelemetry APM that supports distributed tracing, metrics, and logs. You can use it to monitor applications and set up automatic alerts to receive notifications via email, Slack, Telegram, and more.
Uptrace stores telemetry data in ClickHouse database. ClickHouse is an open source column-oriented database management system that is designed to process large volumes of data in real-time and to provide fast analytics and reporting capabilities.
Monitoring Kvrocks client
You can use OpenTelemetry and Uptrace together to monitor Kvrocks performance using the go-redis instrumentation:
import "github.com/redis/go-redis/extra/redisotel/v9"

rdb := redis.NewClient(&redis.Options{
    Addr: ":6666",
})

if err := redisotel.InstrumentTracing(rdb, redisotel.WithDBSystem("kvrocks")); err != nil {
    panic(err)
}
if err := redisotel.InstrumentMetrics(rdb, redisotel.WithDBSystem("kvrocks")); err != nil {
    panic(err)
}
Once the data reaches Uptrace, it will generate the following dashboard for you:
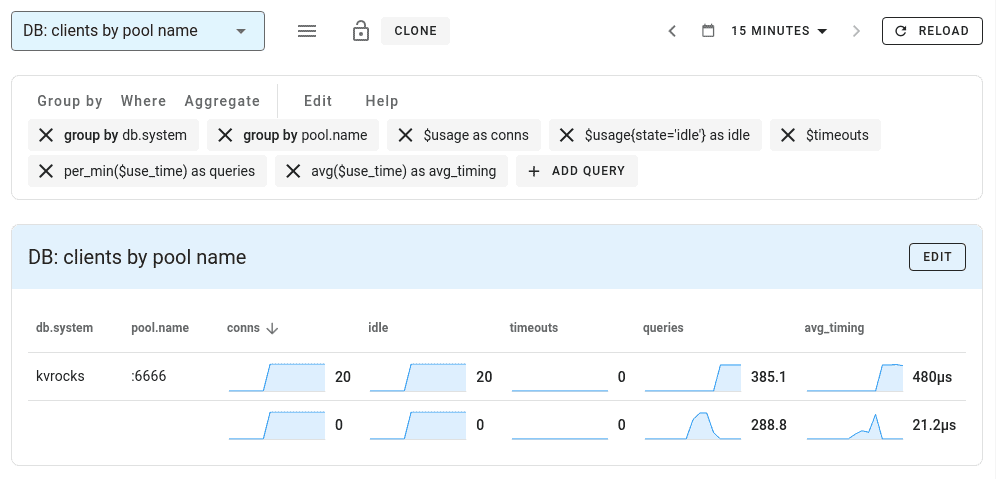
Because OpenTelemetry provides a vendor-agnostic approach, it allows you to choose an OpenTelemetry backend that best suits your requirements, for example, Jaeger or Zipkin.
Monitoring Kvrocks server
You can also configure OpenTelemetry Redis receiver to monitor Kvrocks:
receivers:
  redis/kvrocks:
    endpoint: "kvrocks:6666"
    collection_interval: 10s
The receiver works by parsing the output of INFO command and produces a number of useful metrics:
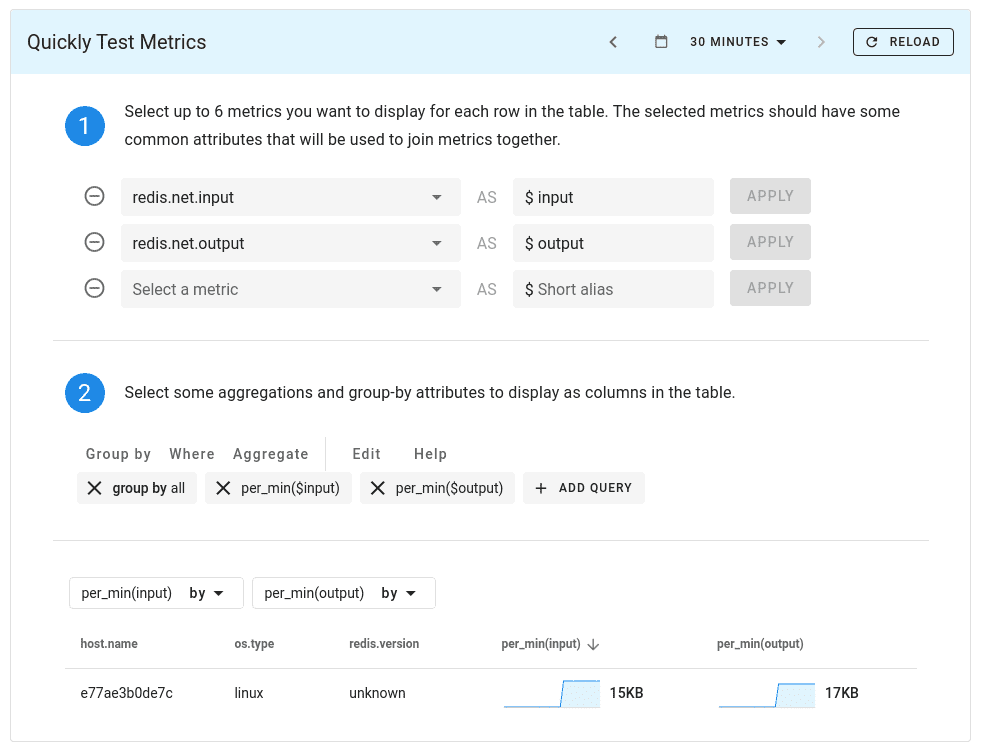
See GitHub example for details.
You can also export the collected metrics to Prometheus using OpenTelemetry Prometheus bridge
Custom metrics
Using OpenTelemetry Metrics API, you can even create custom Kvrocks metrics. For example, the following function parses used_disk_percent to create kvrocks.used_disk_percent metric:
var re = regexp.MustCompile(`used_disk_percent:\s(\d+)%`)

func monitorKvrocks(ctx context.Context, rdb *redis.Client) error {
    mp := global.MeterProvider()
    meter := mp.Meter("github.com/uptrace/uptrace/example/kvrocks")

    usedDiskPct, err := meter.AsyncFloat64().Gauge(
        "kvrocks.used_disk_percent",
        instrument.WithUnit("%"),
    )
    if err != nil {
        return err
    }

    return meter.RegisterCallback(
        []instrument.Asynchronous{
            usedDiskPct,
        },
        func(ctx context.Context) {
            pct, err := getUsedDiskPercent(ctx, rdb)
            if err != nil {
                otel.Handle(err)
            }
            usedDiskPct.Observe(ctx, pct, semconv.DBSystemKey.String("kvrocks"))
        },
    )
}

func getUsedDiskPercent(ctx context.Context, rdb *redis.Client) (float64, error) {
    info, err := rdb.Info(ctx, "keyspace").Result()
    if err != nil {
        return 0, err
    }

    m := re.FindStringSubmatch(info)
    if m == nil {
        return 0, errors.New("can't find used_disk_percent metric")
    }

    n, err := strconv.ParseInt(m[1], 10, 64)
    if err != nil {
        return 0, err
    }

    return float64(n) / 100, nil
}
The metric looks like this in Uptrace:
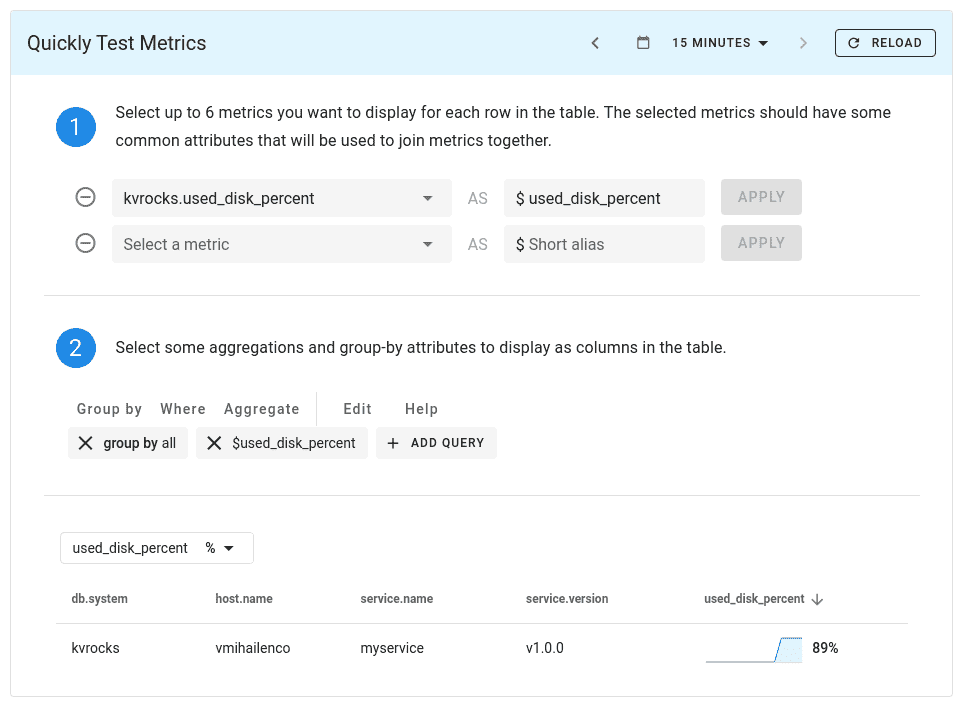
See OpenTelemetry Go Metrics API for details.